

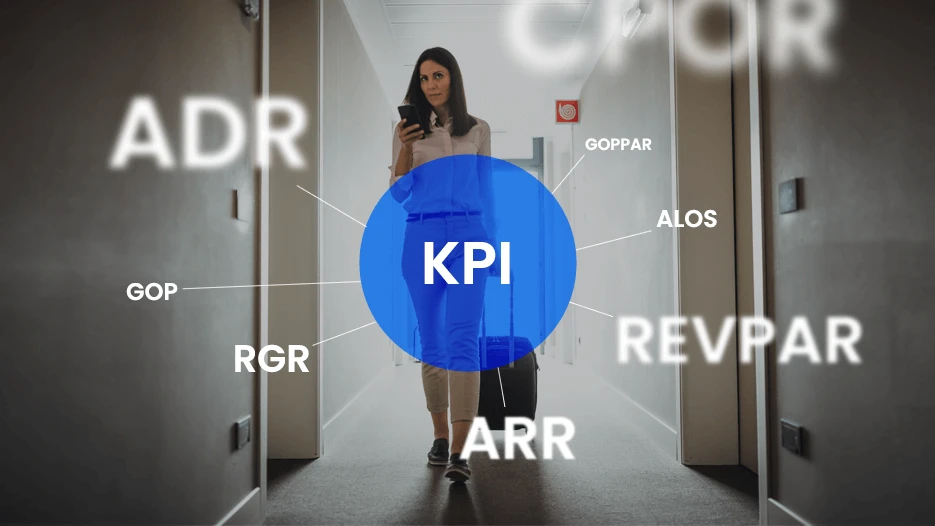
Relying only on occupancy rates and surface level metrics is no longer enough. In 2026, leading hotels gain a competitive edge by analyzing deeper financial insights, including guest acquisition costs, revenue sources, and detailed departmental profitability.
This guide explores the essential hotel metrics that help streamline operations, reduce dependence on third party channels, and increase high value direct bookings. By understanding and applying these key data points, revenue managers can make smarter decisions, strengthen financial performance, and position their property ahead of the competition.
Essential Financial Performance Indicators For Hoteliers
Standardizing core data points provides the necessary foundation for accurate asset valuation and dynamic pricing strategies. Below is a detailed exploration of the fundamental calculations that every successful property manager must utilize daily.
Revenue Per Available Room Dynamics
Revenue Per Available Room (RevPAR) remains the most recognized benchmark of financial performance within the global hospitality sector. This vital calculation combines pricing and occupancy to reveal exactly how efficiently a property monetizes its available room inventory.
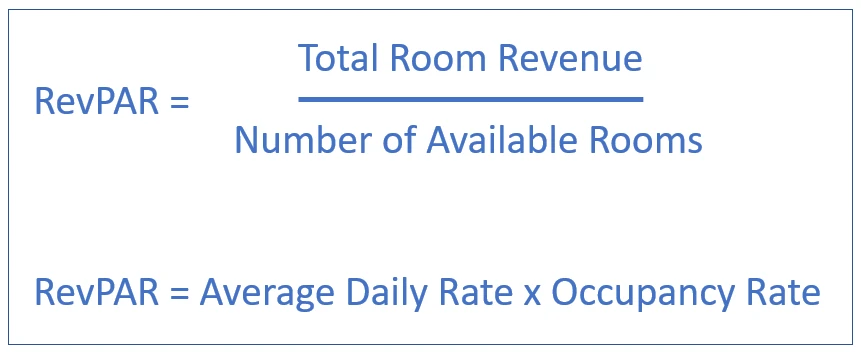
Analysts determine this figure by multiplying the average daily rate by the occupancy rate, or by dividing total room revenue by the number of available rooms. While it does not measure profitability directly, a consistent upward trend with flat occupancy indicates an effective pricing strategy.
By the end of 2025, average occupancy rates hovered around 66.2% nationally in the United States. Yet, this single figure masked significant regional disparities. Top primary markets enjoyed occupancy levels well above 70%, while many secondary markets struggled to reach even 60%.
Consequently, relying solely on standard performance indicators can obscure critical operational weaknesses and limit revenue potential. Leading analysts recommend utilizing multiple data points simultaneously to gain a comprehensive understanding of asset health.
Table 1.1. Core Revenue Performance Calculations
| Metric Name | Calculation Method | Primary Use Case |
| Revenue Per Available Room | Total Room Revenue divided by Available Rooms | Gauging overall room revenue efficiency and market comparability. |
| Average Daily Rate | Total Room Revenue divided by Rooms Sold | Evaluating pricing strategies and market positioning. |
| Occupancy Rate | Rooms Sold divided by Rooms Available | Understanding volume trends and facility utilization. |
Average Daily Rate And Pricing Strategies
The Average Daily Rate (ADR) measures the average price guests pay for a room, providing essential insights into long term pricing sustainability. Operators calculate this precise figure by dividing total gross room revenue by the total number of occupied rooms during a specific timeframe.
Monitoring this figure is crucial because market rates fluctuate frequently based on seasonality, expected demand spikes, and the day of the week. A high average rate paired with low occupancy often signals that a property has priced itself out of the competitive local market.
To maintain strict market competitiveness, revenue managers must consistently benchmark their rates against the Market Penetration Index and local competitors. Stagnant or declining average rates may indicate an overreliance on discounting or a failure to capture high value corporate segments.
Improving this specific measurement requires a strategic balance between product value, dynamic pricing, and targeted sales efforts. Modern property management systems utilize artificial intelligence to recommend optimal rates in real time, maximizing potential revenue without alienating prospective guests.
Here are actionable ways to elevate your daily rate:
- Implement targeted upselling initiatives, such as offering premium room upgrades or exclusive amenities at check in.
- Bundle room rates with high margin spa services or dining credits to create unique package deals.
- Enforce length of stay restrictions during peak demand periods.
- Monitor competitor pricing multiple times daily to capitalize on sudden market sell outs.
If your property struggles to optimize its daily rates, partnering with ROI300 for targeted performance marketing can attract high value demographics directly to your native booking engine.
Occupancy Rate And Capacity Management
The occupancy rate represents the total percentage of available rooms successfully sold during a specific financial period. This fundamental figure is calculated by dividing the number of rooms sold by the total number of available rooms, then multiplying the result by one hundred.
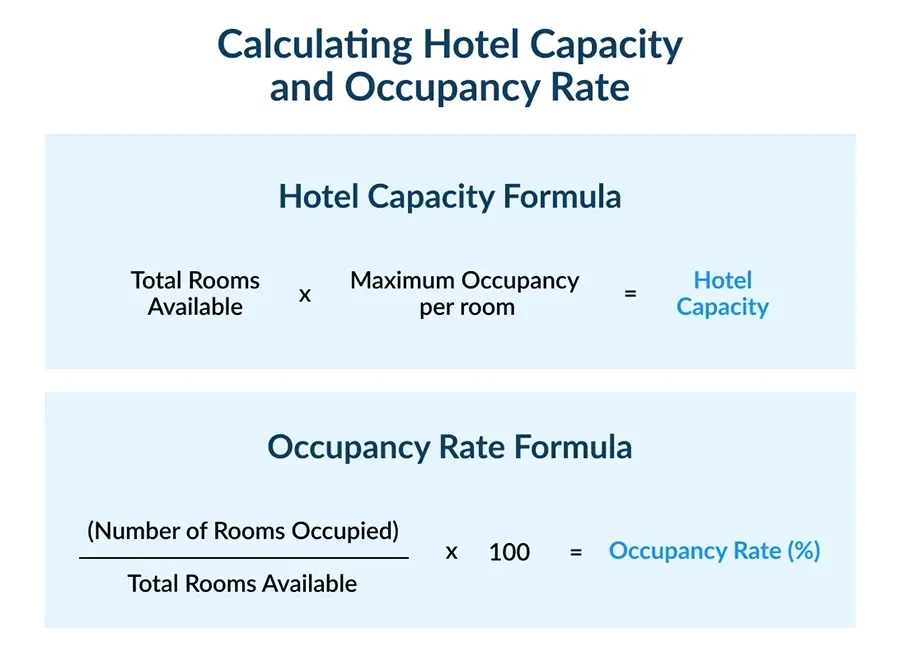
Monitoring this rate over extended periods allows management to identify peak seasons, weekend booking trends, and the immediate impact of local events on demand. However, relentlessly pursuing maximum occupancy at the expense of rate integrity often degrades long term property profitability.
A widespread operational error involves prioritizing full capacity while neglecting the associated variable costs required to service those guests. Selling out a property at deeply discounted rates significantly increases physical wear and tear, elevates housekeeping expenses, and strains frontline staff resources.
Therefore, occupancy must always be analyzed in conjunction with advanced Hotel Metrics to ensure that volume gains actually translate into tangible profit. Data from the 2025 market cycle indicates that properties utilizing balanced occupancy and rate strategies consistently outperformed volume driven competitors.
Revenue Generation Index And Market Penetration
Evaluating competitive market positioning requires utilizing the Market Penetration Index alongside the Revenue Generation Index. These specialized indices compare a specific property’s performance directly against a carefully selected competitive set of rival hotels.
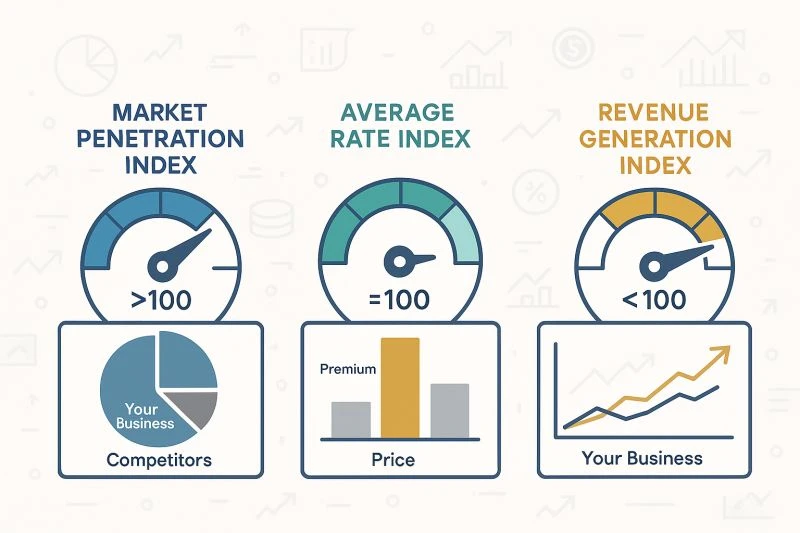
The Market Penetration Index measures true occupancy share, while the Revenue Generation Index measures the property’s fair share of total market revenue. Comparing these calculations helps management accurately determine whether a property is commanding a competitive rate within its local ecosystem.
Failing to monitor market demand outside the immediate competitive set is a damaging error in revenue benchmarking. If the entire destination experiences a massive demand surge, simply matching a local competitor’s artificially low rate leaves substantial money on the table.
These specific indices serve as vital checks and balances, ensuring that internal pricing strategies align perfectly with broader macroeconomic realities. Continuous monitoring of these data points prevents operators from making pricing decisions in an analytical vacuum.
Advanced Profitability And Cost Analysis
Top line revenue figures provide an incomplete picture of a property’s true financial health. Here are the sophisticated calculations required to uncover operational efficiency and bottom line growth.
Gross Operating Profit Per Available Room
Gross Operating Profit Per Available Room (GOPPAR) represents the ultimate measure of operational efficiency and long term financial sustainability for an asset. This calculation subtracts all departmental and undistributed expenses, including both variable and fixed costs, from total revenue before dividing by available rooms.

Unlike rudimentary indicators that focus exclusively on revenue generation, this figure directly links commercial decisions to the absolute bottom line. It clearly highlights whether increased sales actually translate into tangible financial returns or merely cover rapidly escalating operational expenses.
Management teams use this precise calculation to compare performance across diverse property types. Target benchmarks vary substantially by asset class. Limited service properties actively aim for 45% to 50% of standard room revenue. Full service city locations typically target 35% to 40% of total revenue.
Implementing tracking for this profitability indicator requires precise departmental cost allocation across the entire property. Analyzing this figure monthly helps operators identify hidden costs, such as overstaffing or excessive utility usage, which drain profitability.
Total Revenue Per Available Room
Total Revenue Per Available Room (TrevPAR) captures the comprehensive financial output of a property by incorporating all possible income streams. This specific metric includes revenue generated from food and beverage outlets, luxury spa services, valet parking, and mandatory resort fees, divided by total available rooms.
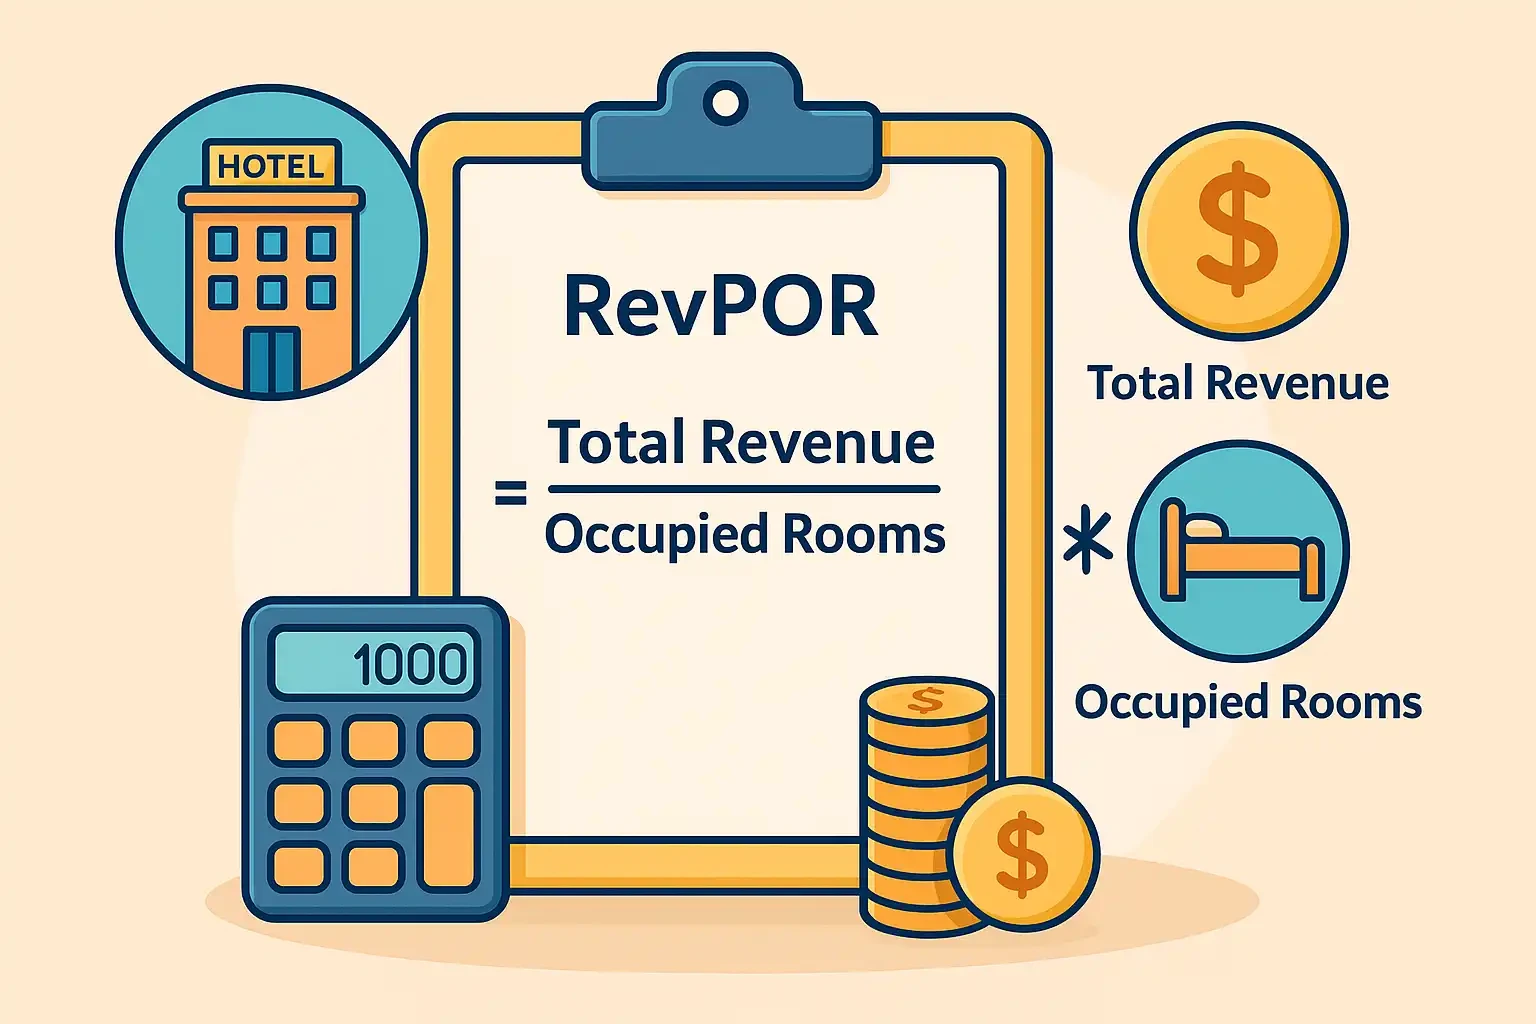
This holistic approach is crucial for full service hotels and resorts where non room spending accounts for a substantial portion of overall income. In the modern experience economy, analyzing total guest value is necessary for accurate financial forecasting and asset valuation.
Consider a realistic scenario where a property generates significant income from extensive conference facilities and premium luxury dining. Relying solely on basic room revenue indicators would drastically undervalue the asset’s true market performance and profit potential.
Total revenue analysis helps executive management identify exactly which specific departments contribute most effectively to the bottom line. It also provides a clear framework for cross departmental marketing strategies aimed at increasing on site guest spending.
Cost Per Occupied Room And Efficiency
Cost Per Occupied Room (CPOR) measures the specific operational expenses incurred to service a single sold unit within the property. Financial analysts calculate this by dividing the total operating expenses related to room operations by the total number of rooms actually sold.

This specific figure encompasses housekeeping labor, complimentary guest amenities, laundry services, and in room utility consumption. Monitoring these expenses is vital for maintaining profit margins, especially when facing inflationary pressures and rising wage demands.
A high service cost typically indicates operational inefficiencies, such as excessive energy usage or suboptimal housekeeping schedules. Tracking this indicator over time allows operators to isolate exact cost drivers and implement targeted efficiency measures.
For instance, a property might quickly identify that escalating energy costs during peak summer months severely degrade their overall profitability per guest. By directly addressing these specific variable costs, managers can actively safeguard profits even when broader market demand fluctuates wildly.
Flow Through And Flex Calculations
Flow through and flex are sophisticated analytical tools that measure a property’s true ability to retain profit during revenue fluctuations. Flow through calculates the exact percentage of additional profit generated from each incremental dollar of new revenue.
The formula requires subtracting budgeted profit from actual profit, then dividing the result by the difference between actual and budgeted revenue. A flow through rate of 55% indicates that for every additional dollar earned, the property successfully retains 55 cents as gross operating profit.
Conversely, the flex metric gauges management’s ability to minimize profit erosion during periods of severe revenue decline. Flex is mathematically represented as the number one minus the calculated flow through percentage. It answers a critical operational question regarding exactly how effectively the leadership team reduces variable costs when top line revenue falls short.
These fundamental concepts dictate that incremental revenue should logically result in higher profit retention because fixed costs are already fully covered. Integrating flow through and flex formulas into monthly financial reviews empowers owners to hold management accountable for converting sales into tangible cash flow.
Table 1.2. Advanced Profitability Metrics
| Metric Name | Formula Definition | Core Business Objective |
| Gross Operating Profit Per Room | Total Operating Profit divided by Available Rooms | Evaluate true management efficiency and bottom line health. |
| Total Revenue Per Room | Total Property Revenue divided by Available Rooms | Assess the holistic earning power of the entire physical asset. |
| Cost Per Occupied Room | Total Room Department Cost divided by Rooms Sold | Control variable expenses and optimize housekeeping labor. |
| Flow Through | Change in Profit divided by Change in Revenue | Measure the exact conversion rate of new sales into pure profit. |
Specialized Revenue Optimization Formulas
Maximizing profitability requires evaluating every single square foot of an asset, including food service and expansive event spaces. Let us explore the specialized formulas designed to measure spatial efficiency.
Revenue Per Available Seat Hour
Revenue Per Available Seat Hour (RevPASH) is a critical calculation for optimizing food and beverage operations within a property. This complex measurement is determined by dividing total dining revenue by the exact product of available seats and total opening hours.
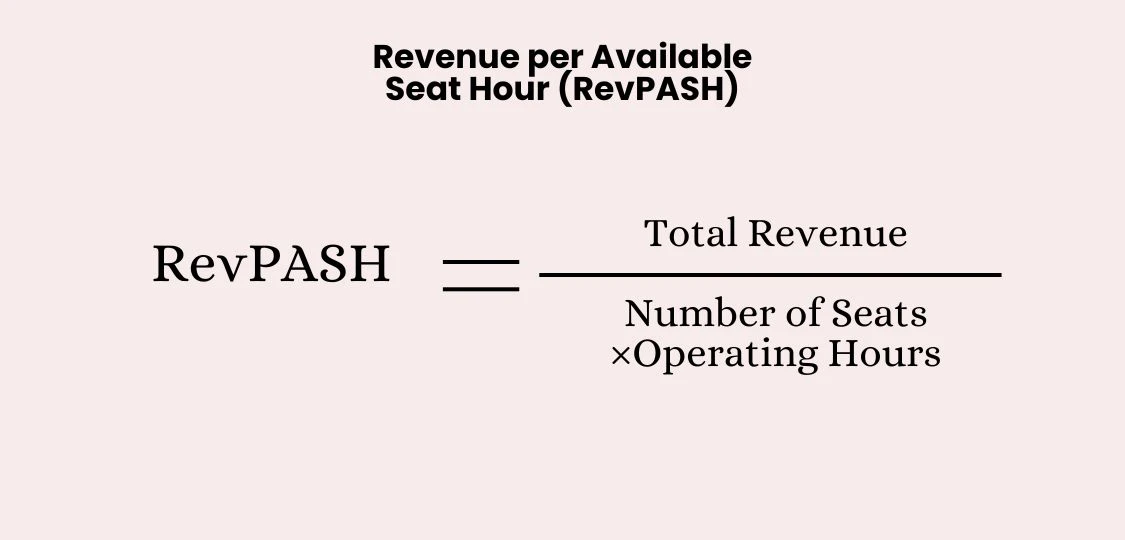
Unlike the average check size, which only tracks individual guest spending, this formula rigorously evaluates the efficiency of space utilization over time. It provides actionable insights into how well a restaurant or bar generates income during specific operational windows.
To effectively utilize this analysis, managers must break down total revenue and guest counts hour by hour using advanced point of sale data. This granular approach reveals performance variations between busy dinner services and sluggish mid afternoon periods.
Adjusting staffing levels or introducing targeted promotions during these slow periods dramatically improves overall departmental margins. Applying this methodology enables leadership to rethink table turnover strategies and physical seating configurations to maximize Hotel Metrics across the property.
Revenue Per Available Square Meter
Revenue Per Available Square Meter (RevPASM) thoroughly evaluates how effectively a property monetizes its physical footprint, encompassing conference halls, luxury spas, and vast lobby areas. This specialized metric is calculated by dividing total generated revenue by the total available square meters of the specific space being analyzed.
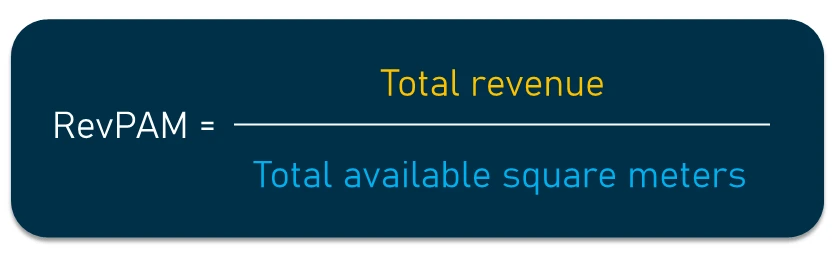
It is particularly relevant for large assets that rely heavily on banquets, corporate meetings, and large scale social events. Analyzing this figure instantly highlights underutilized property areas that could be optimized to generate substantial additional revenue.
Properties often leave massive lobby spaces or vacant meeting rooms entirely unmonetized during off peak days or quiet seasons. A disciplined spatial analysis might prompt executive management to convert a quiet lobby corner into a profitable pop up cafe or boutique retail space.
Comparing the spatial yield of different amenities allows owners to confidently allocate capital expenditures toward the highest returning property renovations. By keeping spatial monetization at the forefront of strategic planning, management continually uncovers hidden revenue streams that enhance total asset valuation.
Ancillary Revenue Streams And Upselling
Ancillary revenue represents the lucrative income generated from supplementary services, including premium room upgrades, spa treatments, and exclusive dining experiences. Tracking these specific revenue streams is crucial because they frequently carry higher profit margins than basic discounted room sales.
In 2024, hoteliers globally earned an average of 941 dollars per agent in monthly upsell revenue, highlighting the financial potential of these secondary income sources. Integrating advanced artificial intelligence into the booking process increases this ancillary revenue before the guest even arrives on property.
The overall financial success of upselling depends on frontline staff motivation and comprehensive sales training. Providing staff with clear performance goals and financial incentives transforms them into effective proactive revenue generators.
By continually tracking these specific metrics, executive management can identify which upsell strategies resonate most powerfully with their target demographics. For instance, luxury guests may purchase spa upgrades, while business travelers strongly prefer expedited services or premium internet access.
Distribution Costs And Net Revenue Tracking
The cost of acquiring a guest heavily influences the actual net profit derived from any booked room. Consider the following insights regarding the intricate correlations between distribution expenses and true net revenue.
Net Revenue Per Available Room And Commissions
Net Revenue Per Available Room (Net RevPAR) strips away the significant costs associated with third party distribution to reveal true unvarnished room profitability. The calculation subtracts all acquisition expenses, such as travel agency commissions and hidden transaction fees, from gross room revenue before dividing by available rooms.
Online travel agencies routinely charge staggering commissions ranging from 15% to 28%, which erodes profit margins to dangerous levels. Relying solely on gross revenue figures creates a profit paradox where high volume entirely masks deteriorating bottom line performance.
By filtering out these hidden acquisition costs, executive management gains a transparent view of actual channel profitability. A high volume corporate account generating thousands of room nights may actually yield poor net returns once global distribution system fees are fully deducted.
In 2025, the global industry witnessed a renewed focus on driving direct reservations to combat skyrocketing third party costs. Direct bookings generally incur a much lower operational cost burden, averaging around 3.5% compared to the financial cuts taken by wholesale partners. Optimizing digital marketing strategies to bypass intermediaries is a primary focus for properties aiming to maximize their net revenue.
Table 1.3. Distribution Channel Profitability Impact
| Distribution Channel | Estimated Commission Range | Profitability Impact |
| Direct Bookings | 2% to 5% | Highest margin retention, enables direct guest communication. |
| Global Distribution Systems | 10% to 15% | Moderate cost, essential for corporate travel segments. |
| Online Travel Agencies | 15% to 28% | High cost, useful for volume but severely degrades net margins. |
| Wholesale Partners | 20% to 40% | Highest cost, traditionally used to fill deeply distressed inventory. |
Customer Acquisition Cost In Hospitality
Customer Acquisition Cost (CAC) measures the absolute total marketing and sales expenditure required to secure a brand new guest. This critical business level metric is calculated by dividing total acquisition expenses by the exact number of new customers gained during a specific financial period.

A low acquisition cost relative to the guest’s projected lifetime value indicates an efficient and financially sustainable marketing strategy. Re attracting a previously converted customer is universally cheaper than finding a brand new one, emphasizing the financial importance of guest retention.
Balancing acquisition expenses requires an integrated approach to data management and precision digital marketing. Properties must heavily leverage robust customer relationship management systems to build comprehensive data rich guest profiles.
To radically decrease these acquisition costs and improve direct conversions, properties frequently seek out specialized digital marketing assistance. By partnering with ROI300, hotels gain access to performance driven SEO strategies designed specifically to reduce reliance on expensive online travel agencies.
Customer Lifetime Value And Guest Loyalty
Customer Lifetime Value (CLV) accurately forecasts the total revenue a business can expect from a single guest over the entire duration of their brand relationship. It actively accounts for the average purchase value, frequency of repeat visits, and all auxiliary spending on property amenities.
As guests develop deep brand loyalty, they naturally make more frequent bookings and significantly increase their on site expenditures, drastically elevating their overall value. Tracking these specific Hotel Metrics allows operators to justify investments in loyalty programs and personalized email marketing.
Loyalty data consistently reveals that high value returning guests frequently utilize expensive auxiliary services, generating significantly more net profit than generic one time visitors. Globally, hotels proudly added 9.85 dollars in extra revenue for every correctly captured guest email address.
Cultivating guest loyalty requires moving away from a purely transactional mindset to a relationship building framework. When properties view guests as long term assets rather than single night occupants, they invest much more heavily in the overall guest experience.
Marketing Efficiency And Return On Ad Spend
Return On Ad Spend (ROAS) measures the immediate gross revenue generated for every single dollar invested in a specific digital advertising campaign. While it provides an essential snapshot of short term campaign efficiency, relying on it exclusively presents massive strategic risks for hoteliers.
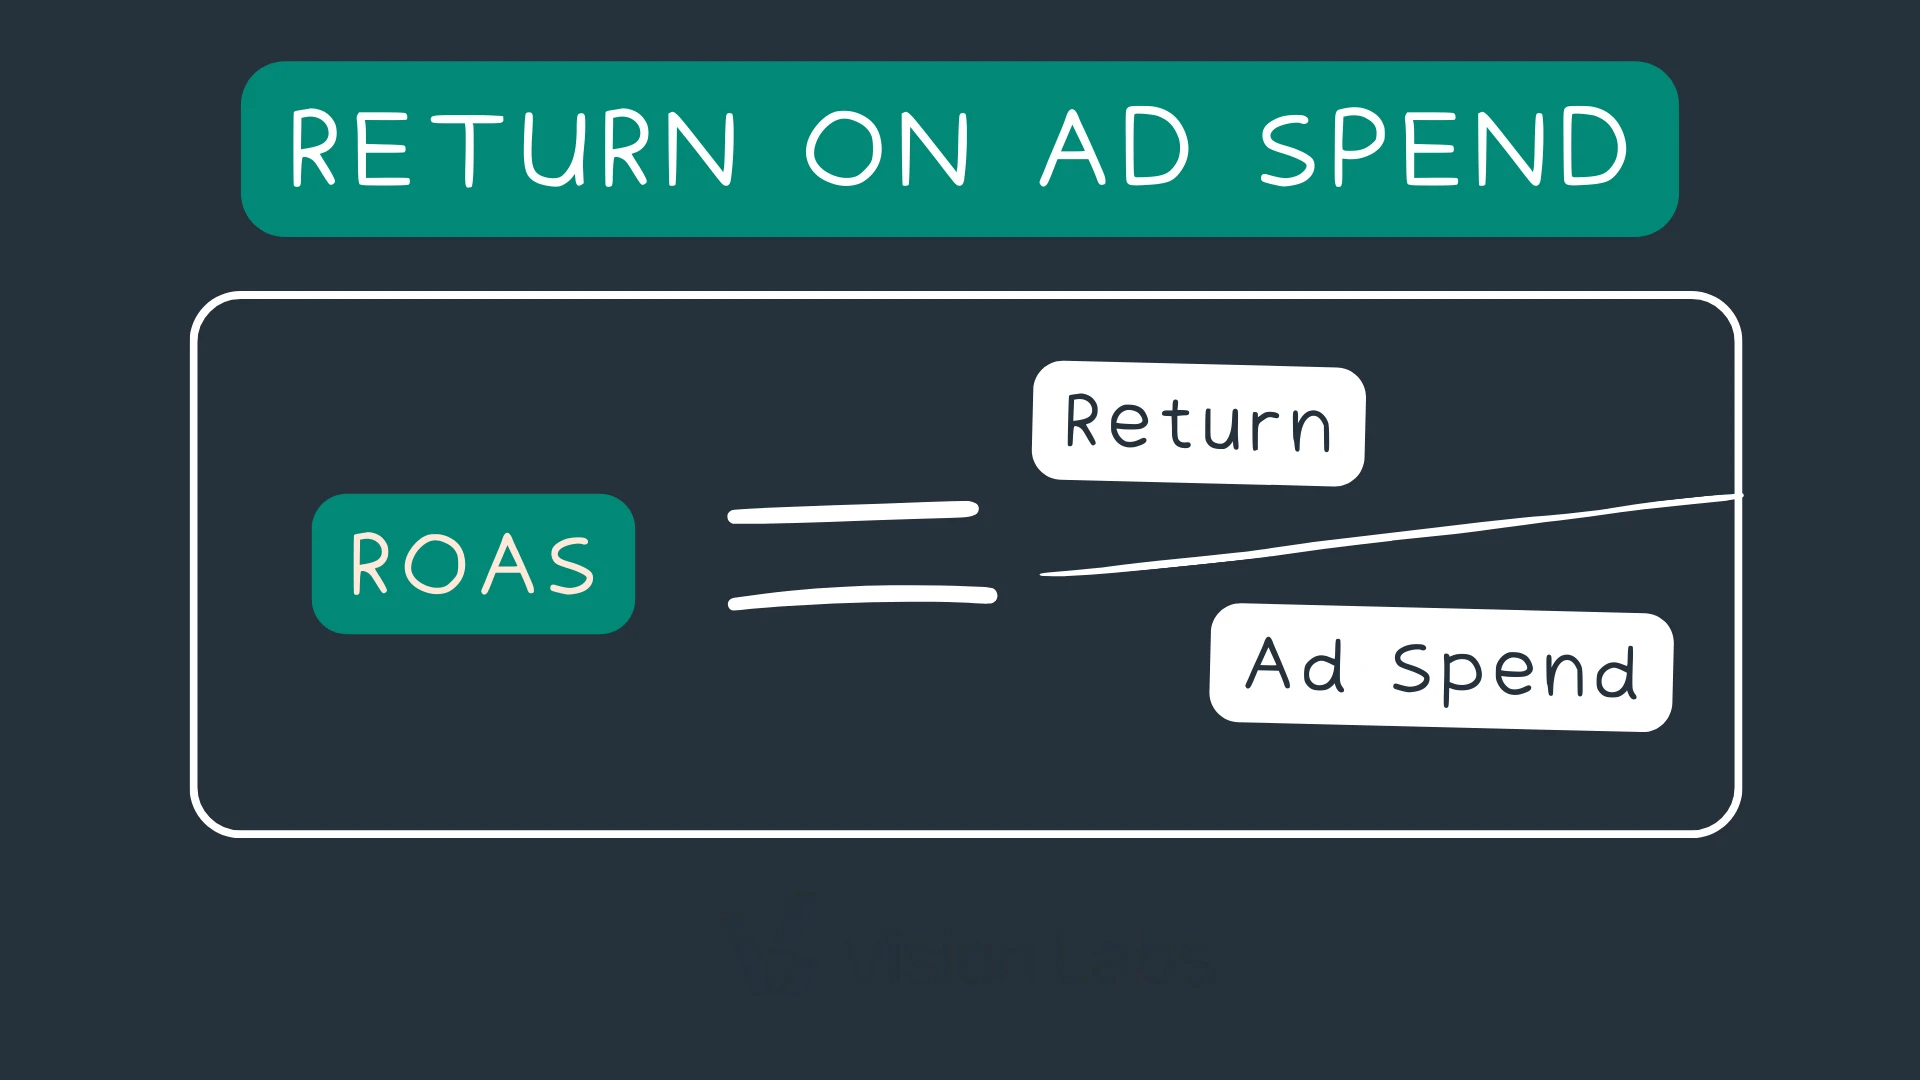
This narrow campaign level metric focuses heavily on single transactions and ignores the profound long term profitability of repeat bookings or auxiliary guest spending. A dangerous focus on immediate ad returns often leads properties to neglect profitable lifecycle marketing strategies.
For example, a targeted advertisement might attract a wealthy guest with a remarkably high propensity for utilizing expensive spa services. If the marketing campaign is judged solely on the initial room booking revenue, the true value of that guest is grossly underestimated.
Implementing complex multi touch attribution models provides a far more accurate representation of exactly how various marketing efforts truly drive revenue. By balancing acquisition strategies with robust retention efforts, properties can drive sustainable growth over the long term.
Guest Satisfaction And Employee Performance Correlations
Operational success depends heavily on the dedicated individuals actively delivering the guest experience. Below is a detailed look at how workforce stability directly impacts online reputation, service quality, and ultimate revenue generation.
Staff Turnover Rates And Financial Impact
High employee turnover jeopardizes organizational performance, severely degrades service quality, and destroys overall profitability. The global hospitality industry consistently struggles with critically high turnover rates, which create severe disruptions and deficits in institutional knowledge.

Constantly recruiting, interviewing, and training new personnel drains financial resources and places undue stress on the remaining workforce. Unhappy or overworked associates are far less likely to provide the exceptional service required to maintain high guest satisfaction scores.
Rigorous quantitative research confirms a very strong correlation between basic job satisfaction, adequate compensation, and an employee’s ultimate intention to leave a property. Improving the overall quality of work life and fostering intrinsic motivation buffers the negative impacts of a high stress hospitality environment.
Labor costs consistently represent the largest single expense category for most properties, making workforce efficiency a top priority. Successful properties utilize algorithmic scheduling and accurate demand forecasting to improve productivity without resorting to mass staff reductions.
Labor Cost Percentages By Region
The labor cost percentage clearly shows exactly how much of a property’s total generated revenue goes directly into staffing expenses. Monitoring this specific figure helps operators balance staff expenses and maximize remaining profits.
In the United States, the lodging industry faced a constrained operating environment characterized by flat consumer demand and severe labor cost inflation throughout 2025. Unionized assets carried massive labor costs equating to an astonishing 43% of total revenue, compared to a more manageable 33.5% at non union locations.
To protect profit margins amid rising hourly wages, executive management teams implemented aggressive labor efficiency strategies. Properties effectively reduced hours per occupied room by 7% to 15% in guest services and housekeeping by leveraging predictive scheduling technology.
Despite these efficiency gains, achieving even a modest boost in profit margins under these conditions required at least a 5% increase in total revenue. Regional disparities remain vast, with the Middle East continuing to outperform other regions in terms of labor efficiency and margin retention.
The Global Review Index And Reputation Impact
Guest satisfaction serves as a highly accurate leading indicator for a property’s revenue maximization potential and overall brand health. Happy guests are significantly more likely to return, highly recommend the property, and enthusiastically engage with upselling initiatives.
The Global Review Index aggregates online reputation data across multiple platforms to provide a standardized benchmark of true guest sentiment. Exhaustive studies demonstrate that a mere one point increase in this index correlates with measurable increases in daily rates and revenue per available room.

Online reviews directly and powerfully influence the booking decisions of prospective travelers, making proactive reputation management mandatory. Negative mentions regarding basic cleanliness or room quality severely depress overall review scores, subsequently destroying the property’s ability to command premium rates.
Conversely, positive electronic word of mouth empowers operators to confidently implement aggressive rate increases without sacrificing their baseline occupancy levels. Management must actively engage with all customer feedback, utilizing sophisticated reputation management software to track sentiment trends over time.
Environmental Sustainability And Green Performance Tracking
Environmental responsibility has rapidly evolved from a niche marketing tactic into a core operational requirement. Review these technological advancements and key performance indicators actively driving sustainable hospitality globally.
Energy And Water Consumption Standards
Tracking raw utility consumption per occupied room is essential for assessing a property’s environmental footprint and operational efficiency. Energy cost per occupied room clearly highlights exactly how much expense is generated by heating, cooling, and lighting each individually sold unit.
Water usage per guest night instantly reveals the performance efficiency of plumbing fixtures and exposes hidden expensive leaks and waste. By meticulously monitoring these specific environmental data points, operators can actively implement targeted conservation strategies that drastically reduce variable utility expenses.
Detailed data driven tracking prevents damaging accusations of corporate greenwashing, providing transparent evidence of a property’s environmental commitments. Forward thinking global brands are establishing incredibly strict net zero targets, supported by highly automated systems that monitor greenhouse gas emissions per occupied room.
Capital expenditures on advanced environmental technology frequently yield impressive returns on investment over a short period. For example, investing heavily in advanced water recycling technology significantly drives down long term variable utility costs, directly improving the gross operating profit margin.
Table 1.4. Environmental Performance Targets
| Sustainability Metric | Measurement Benchmark | Target Improvement |
| Energy Consumption | Kilowatt hours per guest night | 20% reduction through smart systems |
| Water Consumption | Liters per guest night | 20% reduction through fixture upgrades |
| Waste to Landfill | Kilograms per guest night | 40% reduction via circular programs |
| Waste Diversion Rate | Percentage of total waste | 100% increase in recycling and compost |
Waste Diversion And Circular Economy Practices
Waste management remains a critical pillar of any comprehensive sustainability program within the global hospitality sector. Properties rigorously track the total volume of waste sent to landfills per guest night, aiming to drastically reduce this figure through extensive recycling initiatives.
The waste diversion rate measures the exact percentage of total property waste effectively redirected away from landfills toward productive reuse or composting facilities. Industry leaders have successfully implemented complex circular programs that achieve an incredible 80% to 90% reduction in raw landfill contributions.
These advanced circular economy programs also generate profound operational cost savings for the property. Reuse initiatives and smart procurement strategies have been empirically shown to reduce massive supply costs by 30% to 40%.
Furthermore, these initiatives strictly align with the growing consumer demand for authentic highly responsible travel experiences. When a property actively demonstrates its deep commitment to ecological preservation, it can frequently command a higher average daily rate without facing consumer pushback.
Artificial Intelligence And Technological Integration
Artificial intelligence is entirely reshaping how properties manage data, interact with guests, and forecast future market demand. Here are the absolutely critical metrics associated with successfully deploying advanced technological solutions.
Agentic AI And Direct Booking Conversions
The rapid emergence of highly sophisticated Agentic AI is fundamentally restructuring the entire travel discovery and booking funnel for consumers. By the year 2026, artificial intelligence agents will be fully capable of autonomously negotiating booking details and completing massive financial transactions directly with hotel systems.

This revolutionary agent to agent distribution model requires properties to maintain highly structured machine readable data regarding inventory, complex pricing, and specific room amenities. Hotels that effectively surface clear real time content will distinctly stand out in AI driven search environments.
Global search engines are increasingly relying heavily on artificial intelligence overviews to synthesize comprehensive answers for prospective travelers. Properties must ensure their digital presence is fully optimized to prominently appear in these synthesized responses, rather than relying solely on traditional outdated organic link rankings.
The financial impact of successfully implementing predictive AI across a massive property is substantial. Operators eagerly report massive net revenue gains from vastly improved dynamic pricing models and higher conversion rates on targeted upsell offers.
Chatbot Containment Rates And Response Times
Intelligent chatbots have rapidly become an essential component of the modern guest experience, effortlessly handling repetitive inquiries and driving rapid conversions. A crucial performance indicator for these automated systems is the containment rate, which accurately measures the exact percentage of interactions completely resolved without any human intervention.

Tracking containment rates consistently above 80% can reduce customer support costs by up to 40%, freeing front desk staff to focus exclusively on high value interactions. Additionally, monitoring the First Contact Resolution rate ensures that guests receive accurate answers promptly, dramatically boosting overall guest satisfaction.
Speed is paramount in modern digital communication, making the average response time a highly critical technological measurement. Properties should aim for blistering sub three second response times to meet the rapidly escalating expectations of tech savvy travelers.
Automated upsell offers initiated by conversational AI frequently achieve massive conversion rates between 15% and 40%. When these advanced automated systems work flawlessly in tandem with a dedicated human sales team, the total conversion rate can skyrocket to an incredible 40%.
Predictive Analytics And Forecasting Accuracy
Machine learning models continuously ingest vast amounts of real time market data to provide accurate demand forecasts, significantly reducing operational variance. Accurate forecasting improvements allow savvy operators to meticulously plan precise staffing levels, allocate expensive inventory, and manage capital expenditures with unprecedented confidence.
Over extended time periods, these sophisticated artificial intelligence systems improve exponentially as they ingest more complex operational data. The strong correlation between high forecasting accuracy and maximal profitability is universally recognized by leading industry analysts.
Synthetic mystery shopping utilizes advanced AI to perfectly simulate real guests, testing different complex scenarios across chat, voice, and booking flows. This fully automates the quality control process across the entire digital ecosystem, ensuring AI agents always provide highly accurate responses.
Overcoming Common Analytical Pitfalls
Even with incredibly robust access to highly sophisticated financial data, persistent careless human error can easily derail a comprehensive revenue strategy. Observe the most common operational traps that executive management teams must actively avoid.
Selecting An Accurate Competitive Set
A foundational destructive error in competitive benchmarking heavily involves selecting an inappropriate competitive set for comparative market analysis. Directly comparing a specific property’s performance against rival hotels with vastly different premium amenity profiles or chain scales yields flawed analytical insights.

If a highly standard midscale property mistakenly benchmarks its daily room rates directly against a newly renovated ultra luxury resort, it will inevitably misprice its inventory. Highly accurate competitive sets must always consist of direct equivalent market rivals actively offering similar service levels to the exact same target demographic.
Furthermore, inexperienced operators frequently fail to carefully monitor broader macroeconomic market demand operating outside their immediate hand selected competitive circle. Dangerously fixating solely on five localized competitors actively creates a state of operational tunnel vision.
Continually reviewing and adjusting the specific competitive set is an absolute non negotiable requirement for long term analytical accuracy. As local rival properties complete massive renovations or entirely rebrand, their specific relevance to your property’s precise competitive set may alter.
Avoiding The Top Line Vanity Trap
As previously noted, completely analyzing top line gross revenue without accurately deducting massive distribution costs actively creates a dangerous false illusion of profitability. Inexperienced operators often celebrate high occupancy rates driven by massive wholesale contracts without acknowledging the devastating commission structures attached to those bookings.
A property may appear highly successful on a basic gross revenue spreadsheet while simultaneously suffering from negative cash flow due to excessive customer acquisition costs. Treating all varying revenue channels entirely equally is a critical strategic failure that destroys long term asset valuation.
Blindly rushing into massive revenue decisions without analyzing the true exact net contribution of each distinct market segment is another damaging operational pitfall. Executive management must strictly evaluate whether a heavily discounted massive group block actually generates true gross operating profit.
Dynamic Pricing Versus Static Rate Failures
Another highly prevalent damaging operational mistake is maintaining rigid static pricing structures despite massive fluctuations in seasonal market demand. Completely failing to dynamically adjust daily rates during intense peak holiday seasons or offering excessive discounts during slow periods undermines total revenue potential.
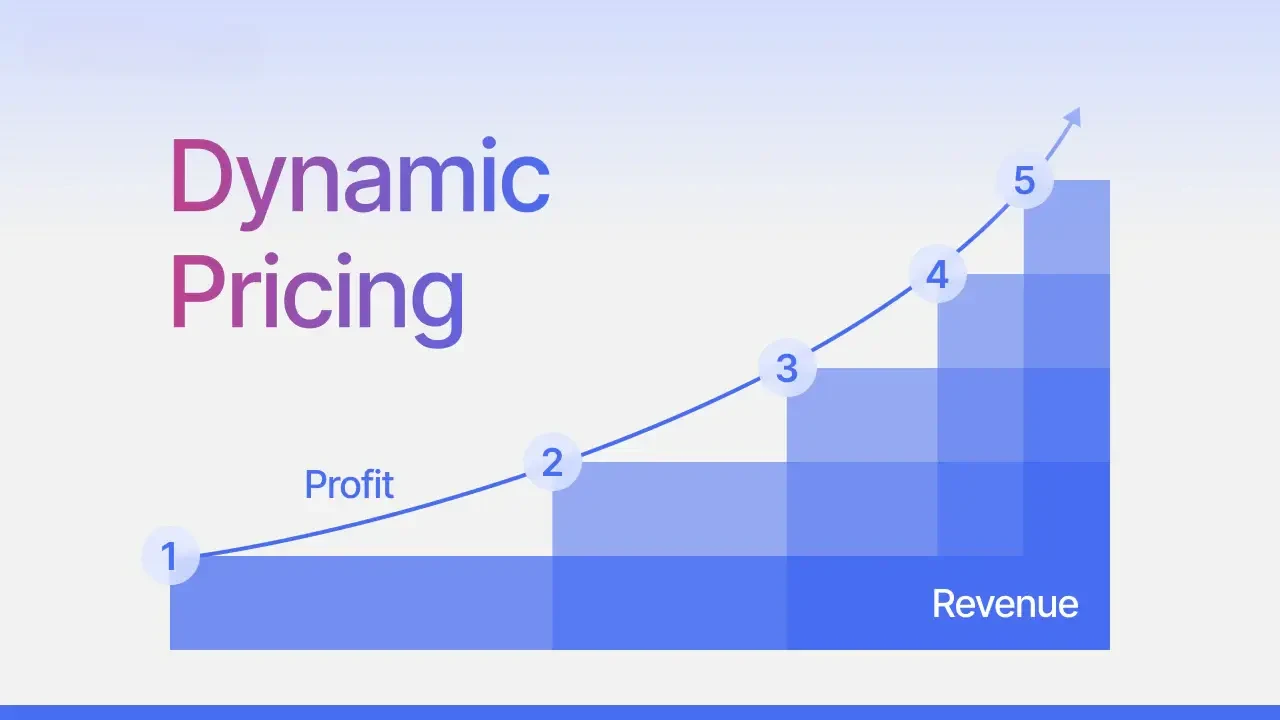
Calculated rates based strictly on exact occupancy levels actively help generate massively more demand during incredibly slow off seasons. This highly precise strategy perfectly captures true maximum revenue when overarching market demand inevitably surges.
Many valuable properties still rely too heavily on outdated manual processes instead of embracing sophisticated automated revenue management software. Precision in deep data analysis and flawless technical execution definitively separates successful industry leaders from struggling outdated assets.
Conclusion
The landscape of modern hospitality has definitively evolved far beyond the simple calculus of merely filling physical rooms. Top performing properties have recognized that long term survival demands a strict adherence to deep data analysis.
From mastering flow through models to utilizing Agentic AI for highly personalized upselling, operators must leverage advanced Hotel Metrics to eliminate operational leaks. Relying on outdated vanity metrics like gross revenue while ignoring high online travel agency commissions will inevitably erode your bottom line in a highly competitive market.
To thrive in 2026, properties must focus relentlessly on reducing acquisition costs, elevating guest lifetime value, and driving direct commission free revenue.
Engineering this sophisticated level of digital infrastructure and data reporting requires specialized expertise. Partner with the hospitality marketing professionals at ROI300 to build, automate, and scale a digital presence tailored to your property. Do not leave your long term asset valuation to chance. Contact ROI300 today to dominate search engines and transform your operational data into lifelong high value direct bookings.